Adding SNMP monitoring for network devices in SCOM 2012 has improved substantially over previous versions. SNMP monitoring is great for basic alerting (up/down) and obviously our performance data will come from SNMP; however, to get fairly granular alerting on most network devices we need to leverage syslog. The documentation on this is fairly light and a little inconsistent so I thought I’d post what works for me.
The first step is to get your devices discovered via SNMP. There are several excellent articles on this as follows so I will not reinvent the wheel here. How to Discover Network Devices in Operations Manager SNMP Trap monitoring with SCOM 2012 R2
Create the Groups It is a good idea to create a new management pack to contain the groups and the rules used in syslog monitoring. It simplifies targeting for overrides without getting into additional details of visibility limitations due to sealed and unsealed management packs. Once you have your devices discovered, the next step is to create groups containing similar devices that will share similar syslog events you want to target. For example, you might want to create a group to contain your routers, another for your edge switches, another for your core switches, another for your VoIP telephony, etc. Populate the groups accordingly with the network devices. When you target the members (either via the Explicit Members or the Dynamic Member tabs) you will want to target objects of type Node (System.NetworkManagement.Node). I would add that you will need a pretty solid IP scheme standard in place (e.g. 1-5 in last octet reserved for routers, 6-15 in last octet reserved for switches, etc.) in your environment to leverage the Dynamic Members tab effectively. If you do, this site has helped me quite a bit with the joy that is regex for ip addresses: Working with regular expressions and ip addresses in OpsMgr 2012. Edit (08.23.2015 - I also bit the bullet and posted some details regarding SCOM and regular expressions in a bit more detail that might help at Using Regular Expressions with SCOM 2012 Groups).
Create the Alerts After you have set up your group(s), you are ready to move on to creating the rules that will alert on the syslog messages. Alerts are categorized from the different system components through defined Facility names listed below. Full parameter list is referenced at IANA here.
| Numerical Code | Facility |
|---|---|
| 0 | kernel messages |
| 1 | user-level messages |
| 2 | mail system |
| 3 | system daemons |
| 4 | security/authorization messages |
| 5 | messages generated internally by syslogd |
| 6 | line printer subsystem |
| 7 | network news subsystem |
| 8 | UUCP subsystem |
| 9 | clock daemon |
| 10 | security/authorization messages |
| 11 | FTP daemon |
| 12 | NTP subsystem |
| 13 | log audit |
| 14 | log alert |
| 15 | clock daemon |
| 16 | local use 0 (local0) |
| 17 | local use 1 (local1) |
| 18 | local use 2 (local2) |
| 19 | local use 3 (local3) |
| 20 | local use 4 (local4) |
| 21 | local use 5 (local5) |
| 22 | local use 6 (local6) |
| 23 | local use 7 (local7) |
Syslog also assigns a criticality to the alert in addition to the location it originates in the system/subsystem. This parameter is known as the Severity of the syslog notification. A table representation of the Severity levels is as follows (referenced from https://en.wikipedia.org/wiki/Syslog#Severity_levels):
| Value | Severity | Keyword | Description/Examples |
|---|---|---|---|
| 0 | Emergency | emerg | Multiple apps/servers/sites. This level should not be used by applications. |
| 1 | Alert | alert | Should be corrected immediately, An example might be the loss of the primary ISP connection. |
| 2 | Critical | crit | May be used to indicate a failure in the system’s primary application. |
| 3 | Error | err | An application has exceeded it file storage limit and attempts to write are failing. |
| 4 | Warning | warning | May indicate that an error will occur if action is not taken, For example a non-root file system has only 2GB remaining . |
| 5 | Notice | notice | Events that are unusual but not error conditions . |
| 6 | Informational | info | Normal operational messages -no action required. Example an application has started, paused or ended successfully. |
| 7 | Debugging | debug | Info useful to developers for debugging the application. |
A good example for a first rule would be alerting on all Severity 0 events.
-
In the Authoring pane of the Operations Manager console, right click on Rules and create a new Rule.
-
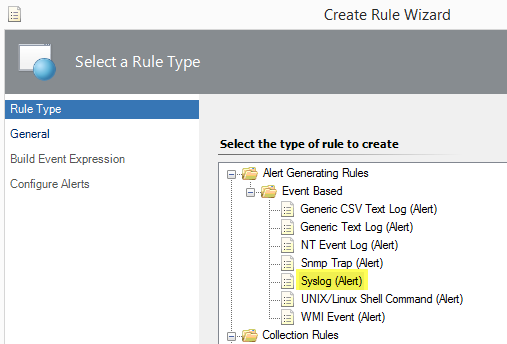
Select the Syslog (Alert) rule under Event Based.

-
Give the rule a name and select the group created earlier. This group should contain objects of the Node class. Be sure to uncheck the Rule is enabled checkbox. These rules should all be created as disabled; they will be enabled via overrides later.

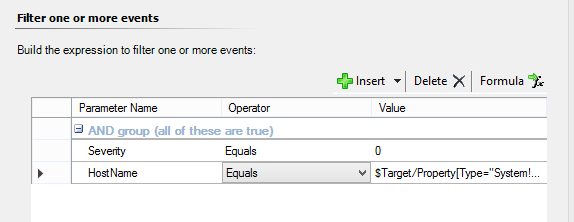
- To configure the filter two parameters need to be defined: Severity and HostName. The severity is self explanatory. The HostName will be critical to prevent the alert from triggering once for each device in the group. As this rule is targeting Severity 0 (zero) events, set the first parameter to Severity Equals 0. Insert an additional parameter and set it to HostName Equals
$Target/Property[Type="System!System.Entity"]/DisplayName$. This will ensure the alert only fires once for each device it matches instead of all group members. This is different from Alert Suppression.
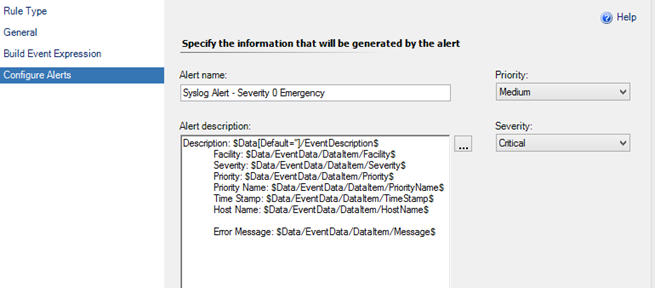
- Finally, you want to add a little more description to the alert notification. I find the following is a fairly descriptive summary:
Description: $Data[Default='']/EventDescription$
Facility: $Data/EventData/DataItem/Facility$
Severity: $Data/EventData/DataItem/Severity$
Priority: $Data/EventData/DataItem/Priority$
Priority Name: $Data/EventData/DataItem/PriorityName$
Time Stamp: $Data/EventData/DataItem/TimeStamp$
Host Name: $Data/EventData/DataItem/HostName$

- Go back into the properties of the rule and select the Configuration tab.
- Select the Edit button under Responses at the bottom.
- Click the Alert Suppression button.
- Select the following checkboxes to prevents duplicate alerts: Event Source, Logging Computer, **and **Event Level. Save the changes.
- The final step is to Override the alert for the target group(s) you want the alert to be functional and set the override to Enable.

Another option with more flexibility is to use the Message parameter in Step 4. This allows for the use of regular expression matching on the description string. For example, let’s say you want to be alerted if a switch detects a duplicate IP or MAC address on the network. This can be done with a single parameter line as follows:
Message Matches regular expression duplicate.*address
Where “Message” is the Parameter Name; “Matches regular expression” is the Operator; and “duplicate.*address” is the Value. In “duplicate.*address”; the “dot” means to match any character and the “asterisk” means to match any number of times. Therefore, this would match both “duplicate ip address” as well as “duplicate mac address” using SCOM Regular Expression Support.
This method worked for me because I had hundreds of network devices across multiple subnets and this approach allowed me to group the similar devices together and then target all the custom rules I created to the groups where they were applicable based upon the message. This might also be approached from a completely different angle where the rules targeted the server objects receiving the syslog alerts themselves (agents or management servers) instead of Node objects although that might not scale for large environments. Either way, this was mainly a way for me to document what I did for later reference. I hope it may have saved you some time in your configuration.